Monitoring NGINX Traffic using Grafana Prometheus
I had a customer who using nginx for performance testing and api mockup. I mean, it just works, but we don’t really know what’s going on in the nginx. So, i think monitor it would be very helpful for our client.
Stack Required
Nginx-prometheus-exporter > Expose data to Metric
Prometheus-nginxlog-exporter > Expose data to Metric
Prometheus > Data Source
Grafana > Data Visualization
Concept
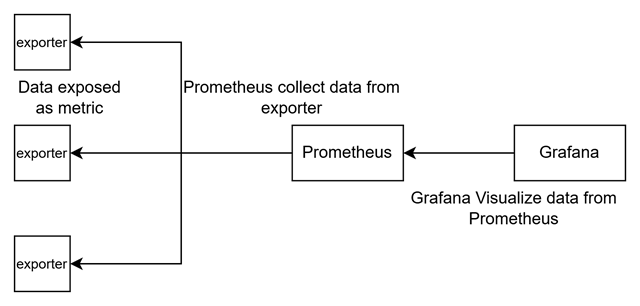
Here’s what happen in this picture
Exporter expose as metric
Prometheus collect data from metric
Grafana expose data from Prometheus
So, in this article, we will focus on exporter that expose data related to nginx.
NGINX
Nginx (pronounced “engine x” /ˌɛndʒɪnˈɛks/ EN-jin-EKS) is a web server that can also be used as a reverse proxy, load balancer, mail proxy, and HTTP cache.
Install
You can install nginx using this command
sudo apt update
sudo apt install nginx
Or follow the official nginx here
After that, you can verify your nginx is already running.
sudo nginx -v
Exporter
Prometheus Exporter, or Exporter is a tool that transforms metrics from specific sources into a format that can be ingested by Prometheus. There are various types of Prometheus Exporters available, including the Elasticsearch Exporter, MySQL Exporter, Node Exporter, prom-client for Node.js Prometheus metrics exporter, Postgres Exporter, Redis Exporter, and more. Of course, you can also build your own exporter.
There are two exporter that i will use for nginx.
Nginx-prometheus-exporter
Nginx has their own monitoring, and it’s called stub_status. You can enable it by adding location inside nginx.conf
Setup Nginx
Add stub_status location on nginx.conf.
location /nginx_status {
		stub_status;
}
After that, you can access it from http://localhost/nginx_status
Active connections: 1
server accepts handled requests
 1 1 1
Reading: 0 Writing: 1 Waiting: 0
Nginx-prometheus-exporter collect data from stub_status, and it will convert to metrics. You must enable stub_status to use this exporter.
Install
I made a script to install nginx-prometheus-exporter here.
Then, you can access the metrics
Prometheus-nginxlog-exporter
Prometheus-nginxlog-exporter collect data from file access.log, and it will convert to metrics.
Setup Nginx
You can edit log format nginx, and make sure it match to config from Prometheus-nginxlog-exporter.
Nginx has their own monitoring, and it’s called stub_status. You can enable it by adding location inside nginx.conf
http {
	log_format custom '$remote_addr - $remote_user [$time_local] '
				  '"$request" $status $body_bytes_sent '
				  '"$http_referer" "$http_user_agent" "$http_x_forwarded_for" '
				  '$upstream_connect_time $upstream_header_time $upstream_response_time $request_time';
	access_log /var/log/nginx/access.log custom;
After that, you need to create config.yaml to run Prometheus-nginxlog-exporter, or you can follow the installation.
listen:
  port: 9114
  address: "0.0.0.0"
  metrics_endpoint: "/metrics"

namespaces:
  - name: nginx
    format: "$remote_addr - $remote_user [$time_local] \"$request\" $status $body_bytes_sent \"$http_referer\" \"$http_user_agent\" \"$http_x_forwarded_for\" $upstream_connect_time $upstream_header_time $upstream_response_time $request_time"
    source:
      files:
        - /var/log/nginx/access.log
Install
I made a script to install prometheus-nginxlog-exporter here.
Then, you can access the metrics
Note : not recommended using root, but you can create a user to access file access.log
Now, your exporter is ready to be collected by prometheus.
Prometheus
Prometheus is a systems and service monitoring system. It collects metrics from configured targets at given intervals, evaluates rule expressions, displays the results, and can trigger alerts when specified conditions are observed. Basically, Prometheus collecting metrics from exporter.
You can use docker, linux, or even windows to run prometheus. Let’s prepare the configuration for prometheus
config.yml
global:
  scrape_interval: 15s # Set the scrape interval to every 15 seconds. Default is every 1 minute.
  evaluation_interval: 15s # Evaluate rules every 15 seconds. The default is every 1 minute.
scrape_configs:
  - job_name: "nginx"
    static_configs:
      - targets: ['192.168.137.248:9113']
        labels:
          service: 'basic_status'
      - targets: ['192.168.137.248:9114']
        labels:
          service: 'nginx_log'
Install
I made a script to install prometheus here.
Or you can using docker
docker run --name prometheus -d -p 9090:9090 prom/prometheus
Then, copy prometheus.yml and restart prometheus
docker cp prometheus.yml prometheus:/etc/prometheus/
docker restart prometheus
Then, you can access the web
After that, you can open target menu and wait until the exporter are ready
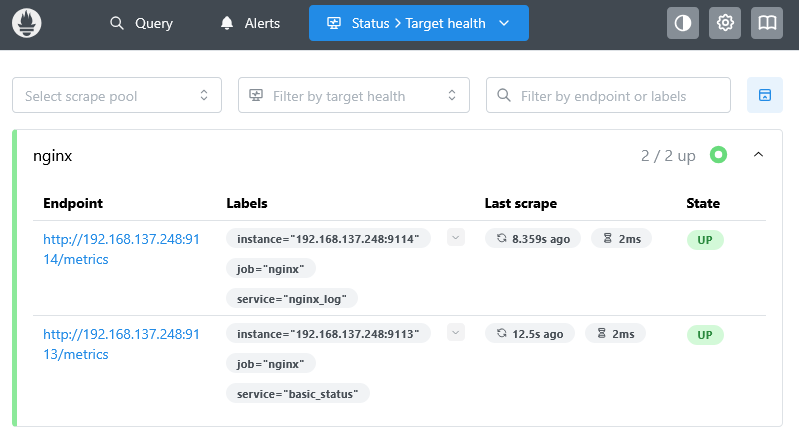
Now your data are ready to visualize by Grafana.
Grafana
Grafana is a multi-platform open-source analytics and interactive visualization web application that can produce charts, graphs, and alerts for the web when connected to supported data sources. Grafana can be used to visualize data from prometheus to charts, graphs and alert for the web when connected to supported data sources.
You can follow the installation from official here
Or You can use docker
docker run -d --name=grafana -p 3000:3000 grafana/grafana
Next, login to grafana -> Select Data sources -> Choose Prometheus -> Input your prometheus address
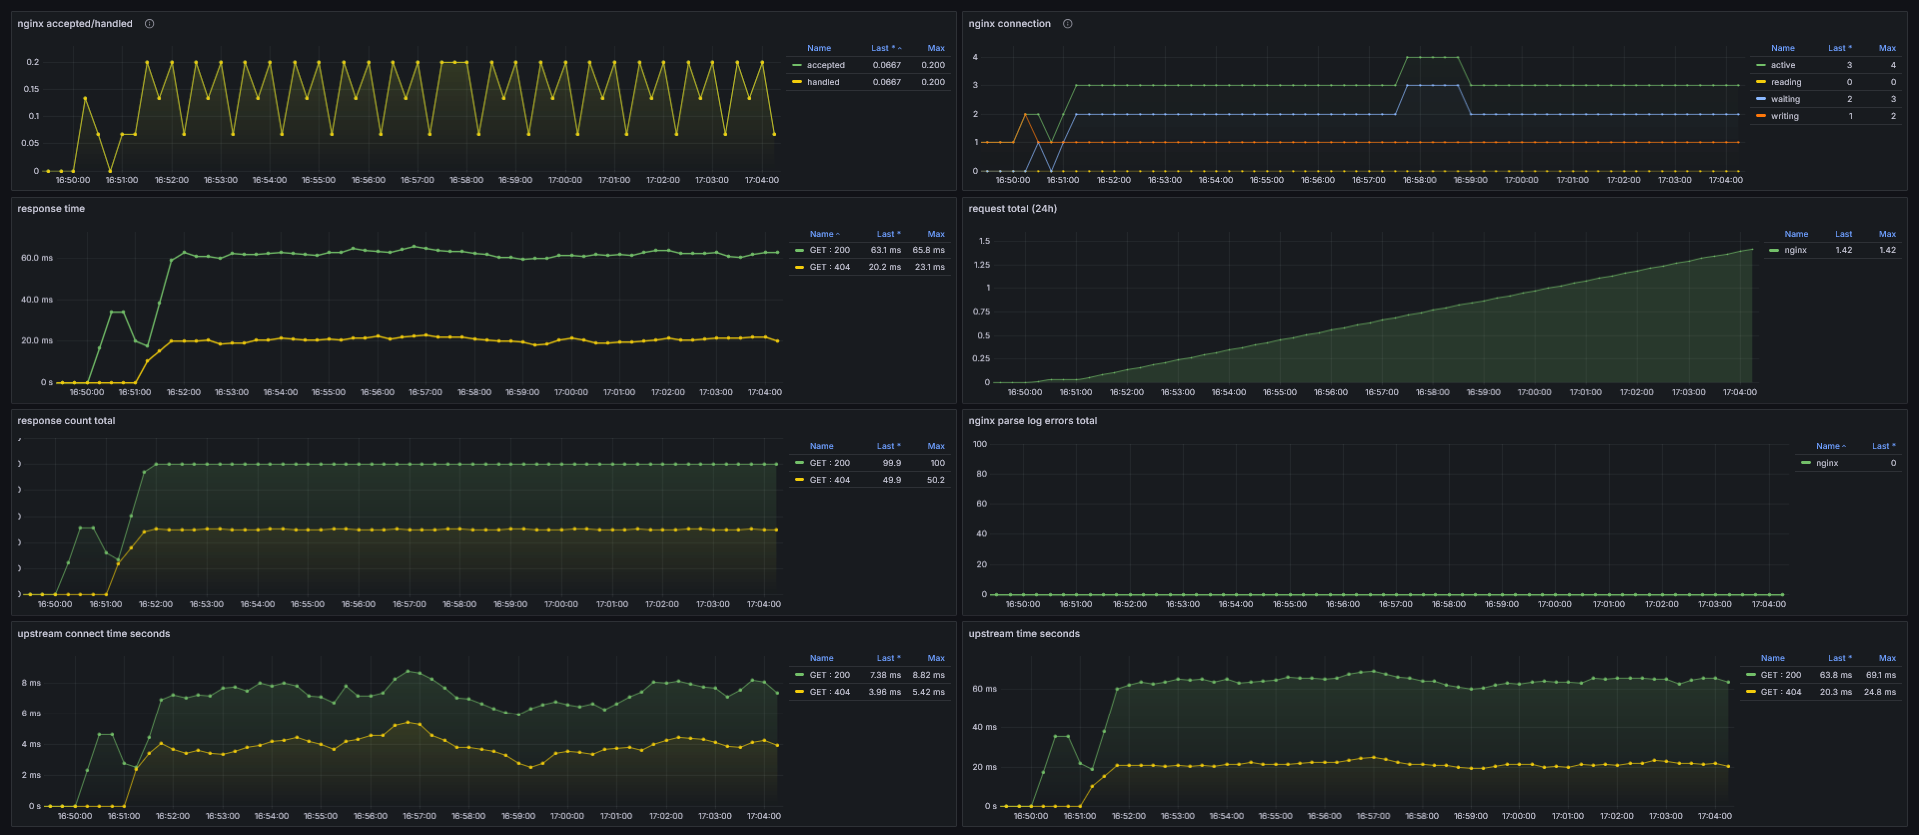
Then, go to Dashboard, and import the dashboard file here
Next, import the dashboard, go to every panel and change the datasources to prometheus that you recently start, or if you know the uid datasource, you can replace all of the uid from the json file.
After that, the dashboard is ready and you can monitor your nginx.